Core Feature Modules
Detailed guide to ximu monitoring, insights, and optimization tools.
1. Overview (Brand Influence Dashboard)
The primary dashboard for a complete view of brand performance.
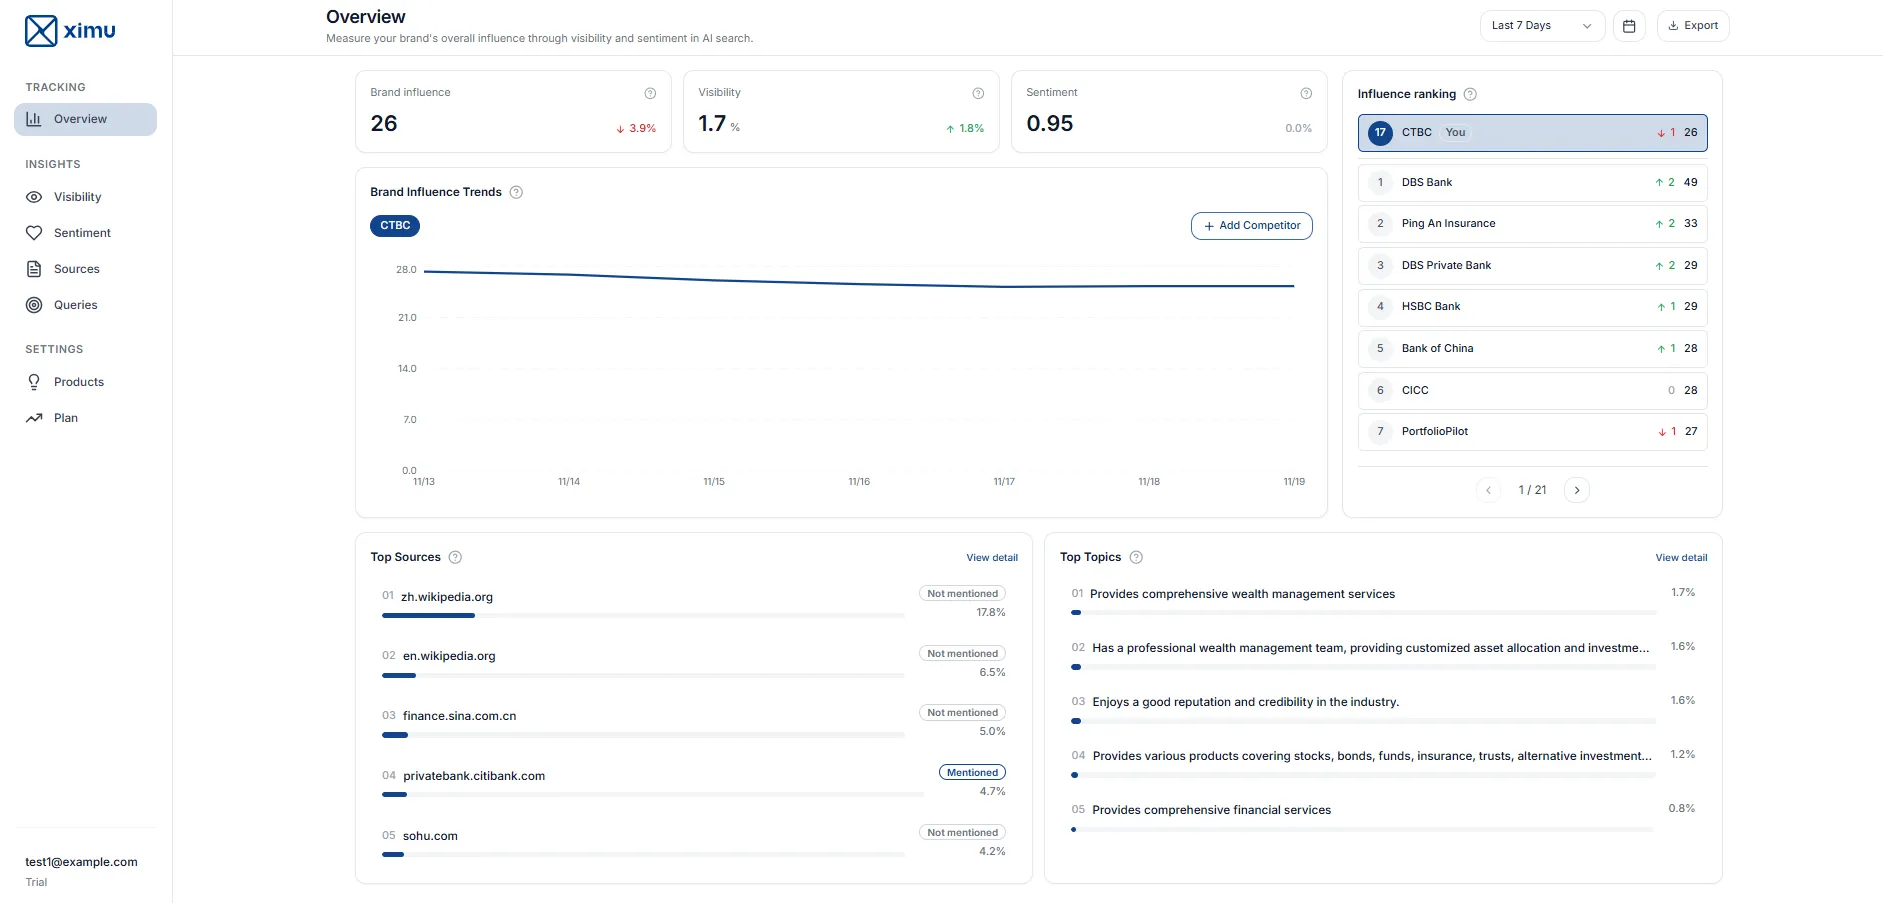
Overview Summary & KPI Cards
- Brand Influence: A core indicator combining visibility and sentiment score.
- AI Visibility: The overall exposure and frequency of your brand in AI-generated answers.
- Sentiment: The average emotional tone expressed by AI when mentioning your brand.
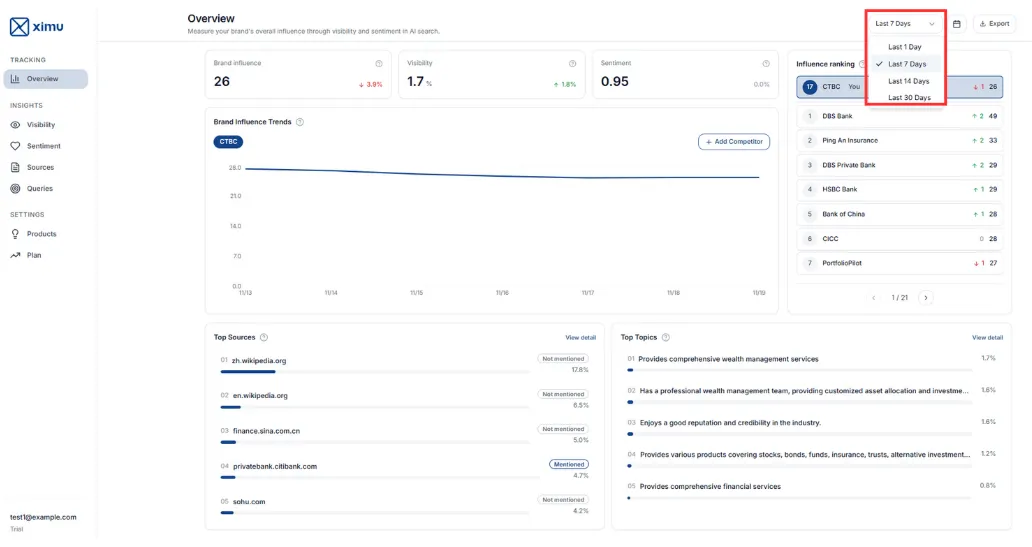
Brand Influence Trend Chart
Visualizes daily influence scores for your brand and up to five competitors. Supports time ranges: 1, 7, 14, 30 days, or custom.
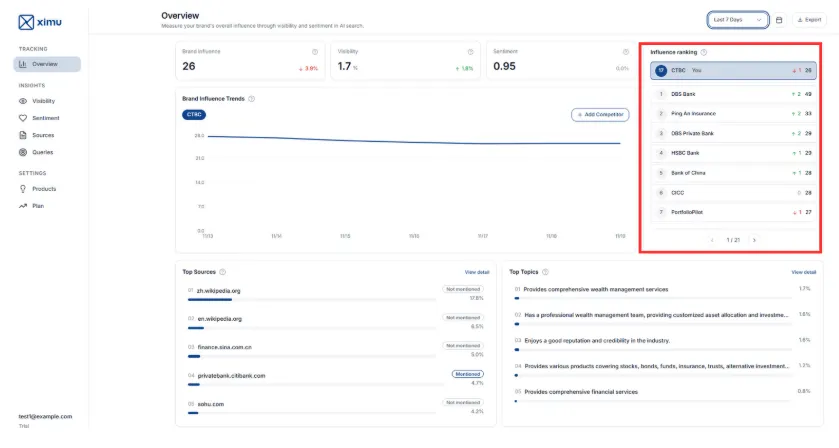
Brand Influence Ranking Table
Shows real-time rankings, influence scores, and day-over-day changes compared to competitors.
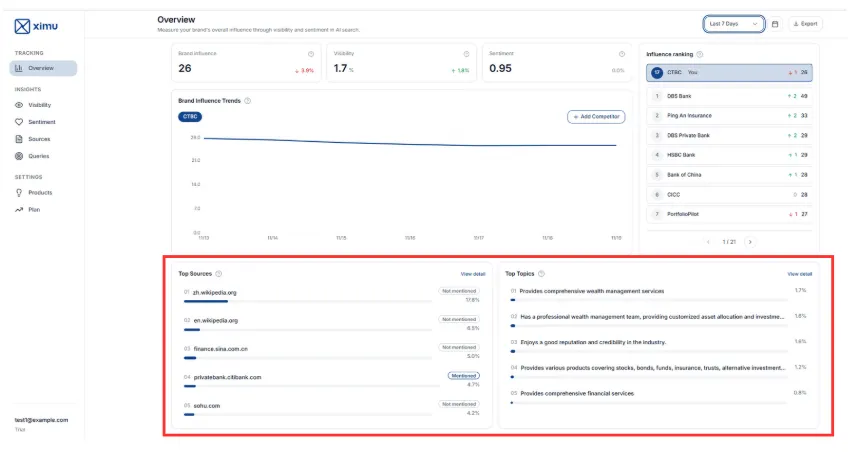
Top Sources and Topics
- Top Sources: Lists the top 5 websites most frequently cited by AI, indicating if your brand was mentioned.
- Top Topics: Highlights the top 5 topics most strongly associated with your brand.
2. Visibility Analysis
Deep dive into how often and where your brand is appearing.
Visibility Metric Cards
Focus on three key metrics:
- mention rate
- ranking position
- content share
Trend × Ranking Linked View
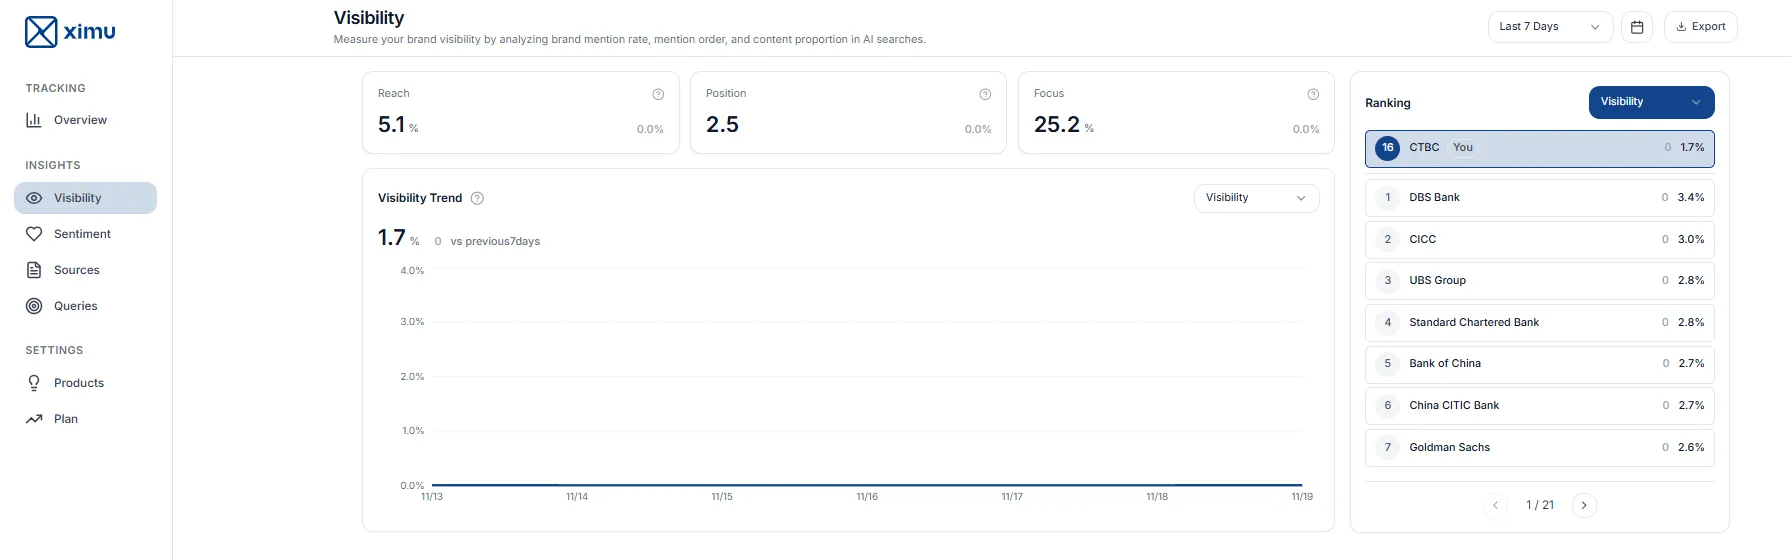
- Left Side: Historical trends across different visibility metrics.
- Right Side: Real-time ranking table with sortable criteria across competitors.
- Visibility Heatmap (Coming Soon): A matrix view revealing brand mention rates across different topic categories and source types.
3. Sentiment Analysis
Understanding the qualitative tone of AI responses.
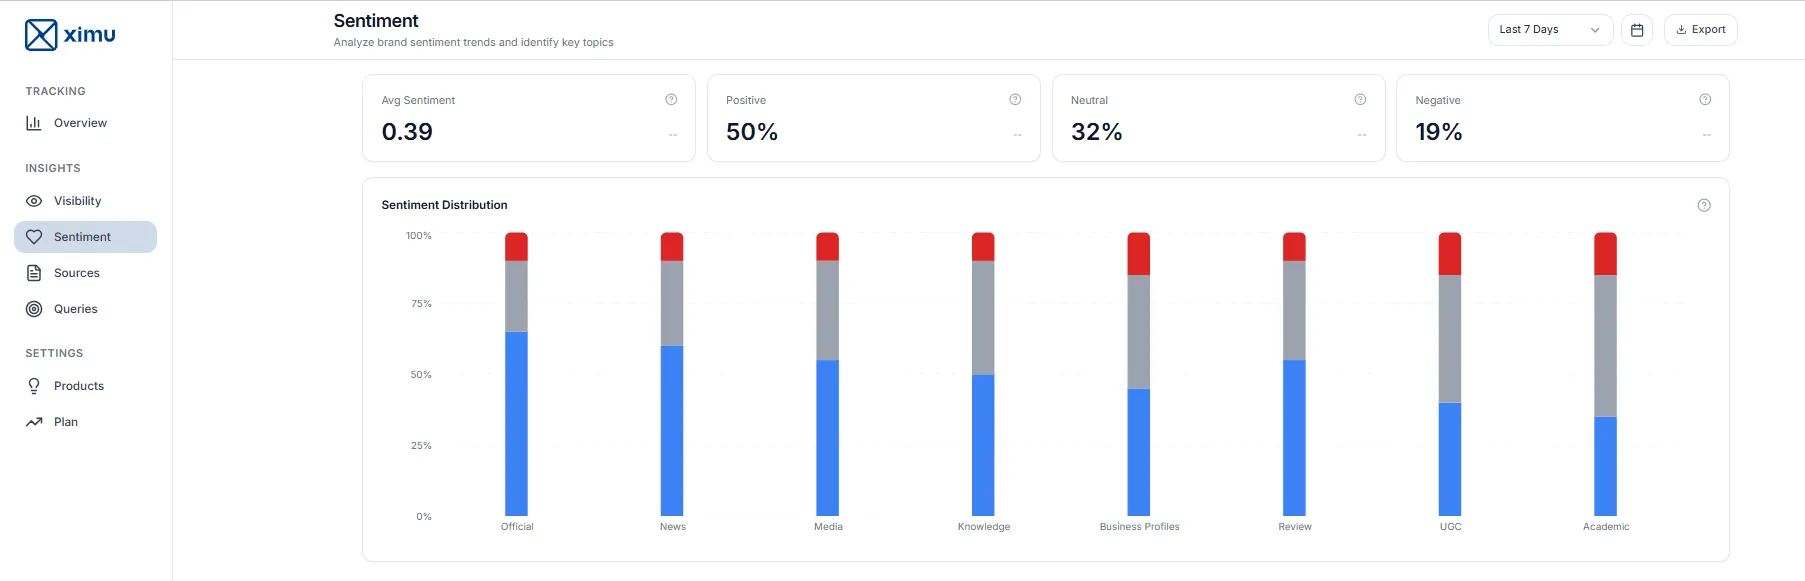
- Sentiment Metric Cards: Shows the overall average sentiment score and the distribution of positive, neutral, and negative responses.
- Sentiment by Source Type: Tracks how sentiment varies across different categories of websites (e.g., tech news vs. social forums).
- Top Sentiment Topics (V2.0 Coming Soon): Lists the specific topics that drive the most positive or negative AI sentiment.
4. Source Analysis
Analyzing the origins of AI knowledge.
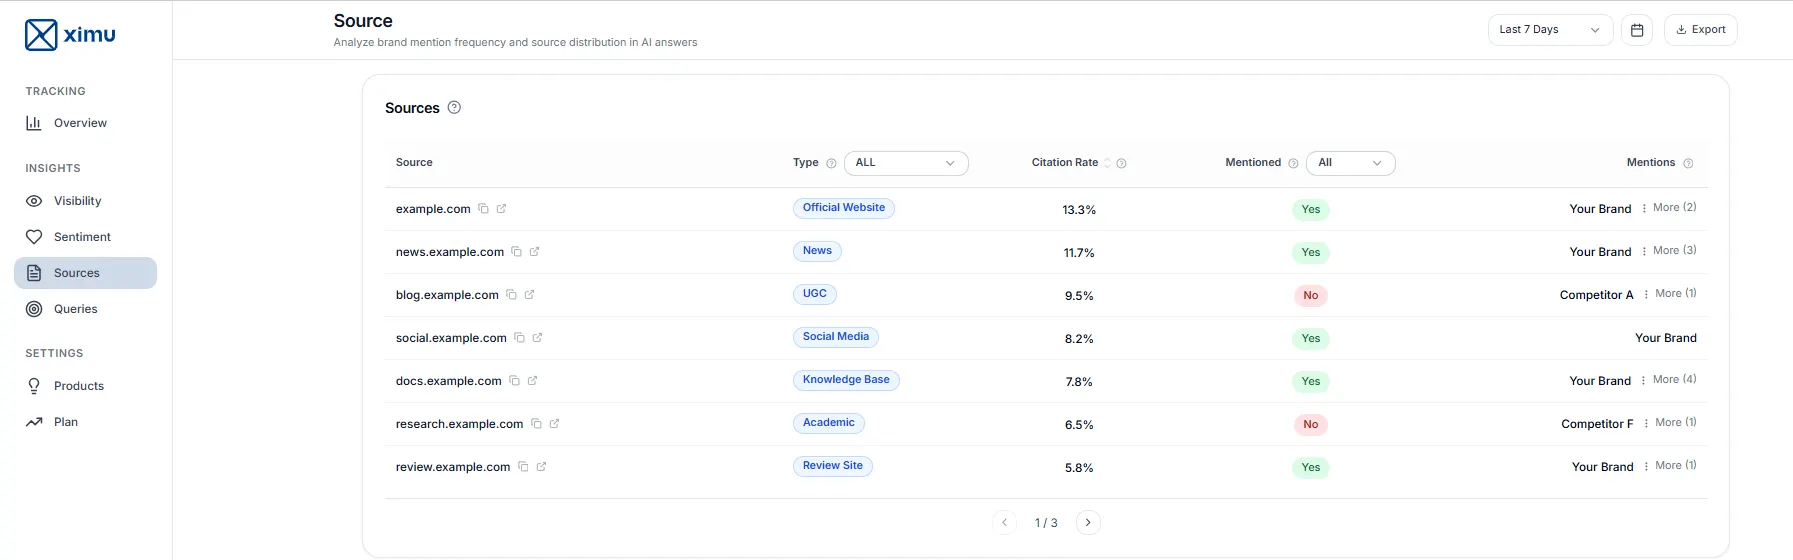
- Source Table: A detailed list of all citation sources, including website type, citation rate, and whether your brand was mentioned in that specific source.
- Source Distribution: A visualization of how different website categories contribute to shaping your brand’s AI narrative.
5. Prompt Insights
Direct insight into user behavior and AI logic.
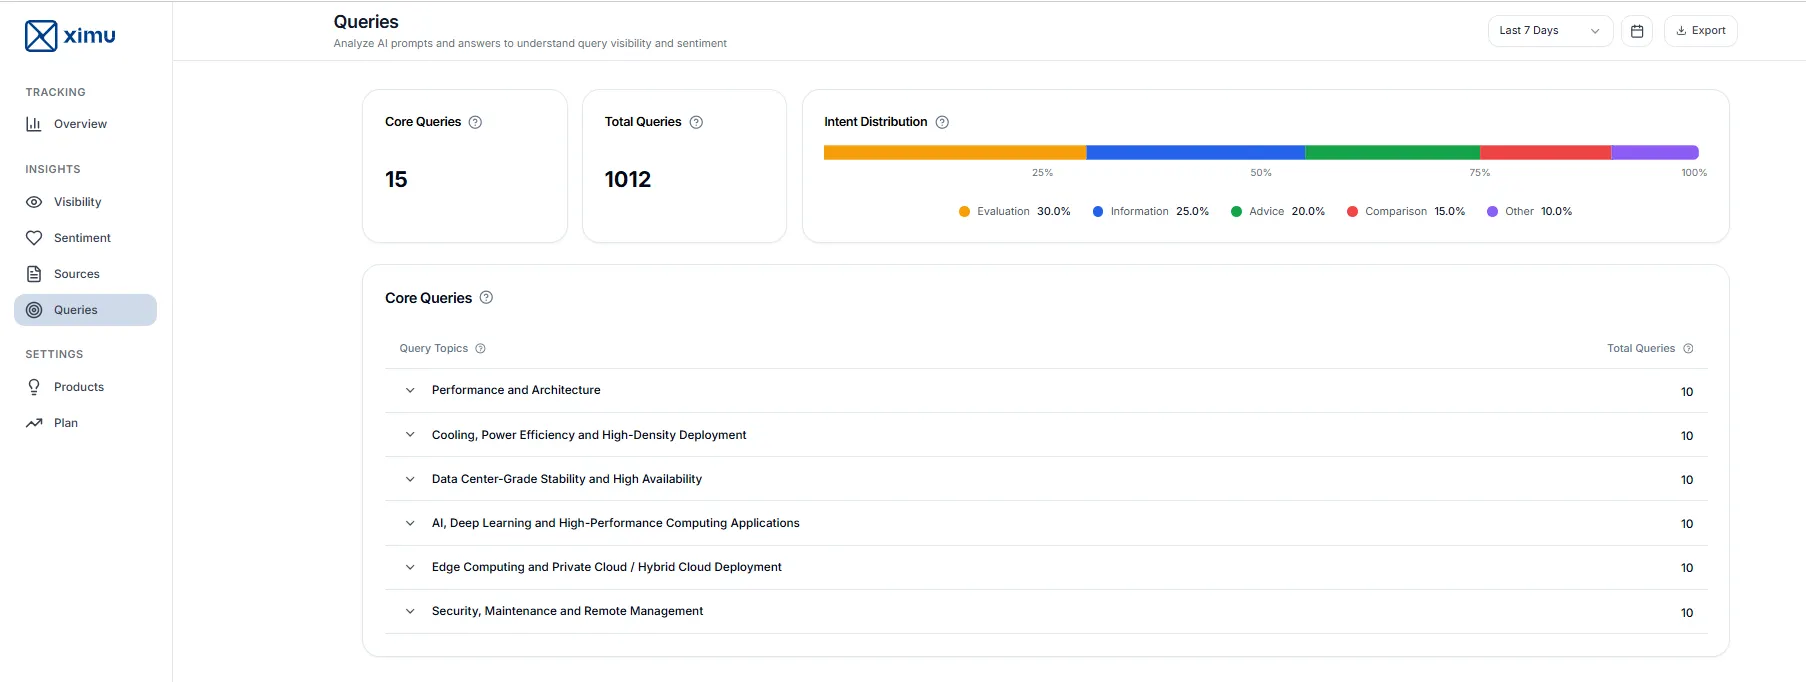
Q&A Analysis
- Intent Distribution Chart: Categorizes user intents such as "Information Retrieval," "Product Comparison," or "Purchase Evaluation."
- Core Question Table: Groups clustered key topics with actual user queries and the corresponding AI responses.
- Marketing Value: This section reveals direct user intent and questions, providing a roadmap for content and optimization strategies.